What Is Volume Profile?
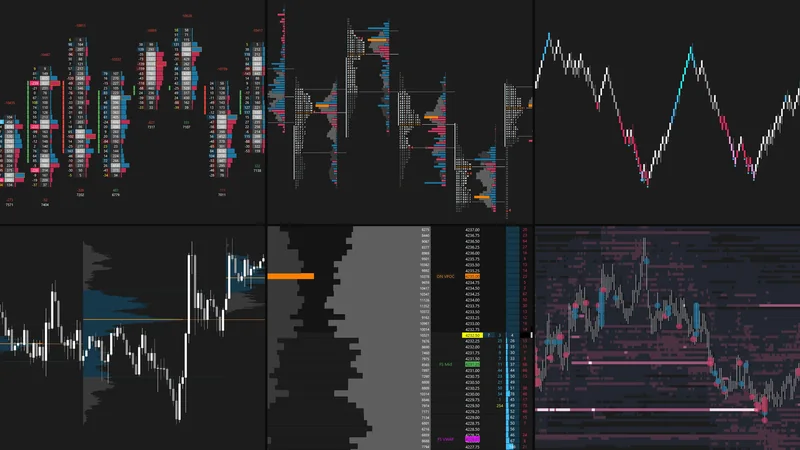
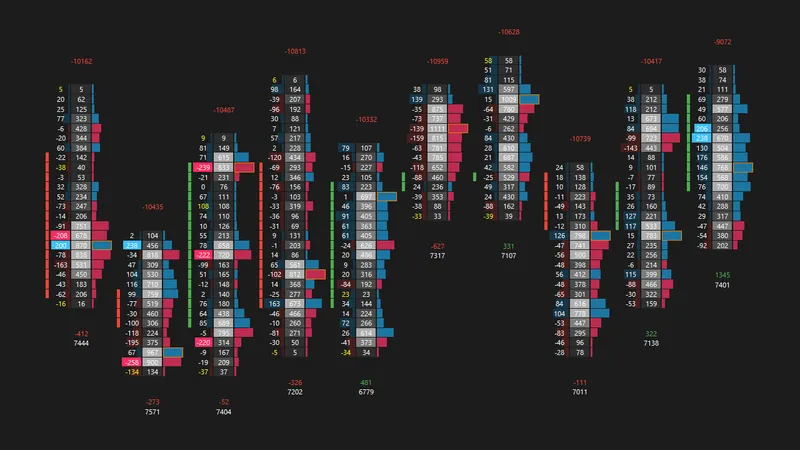
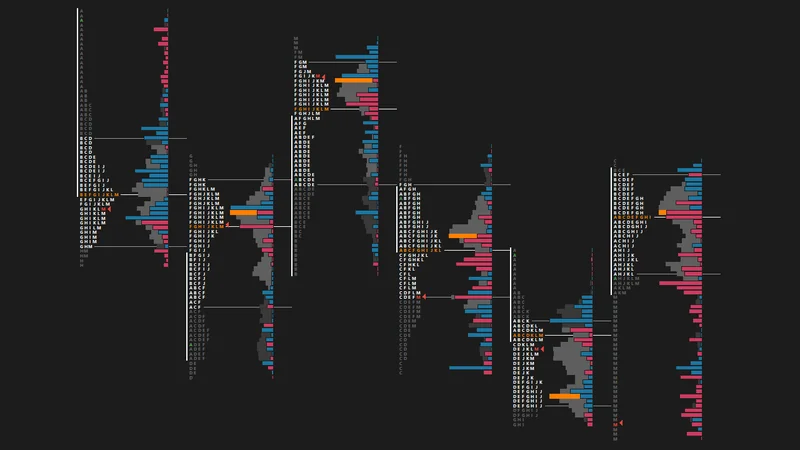
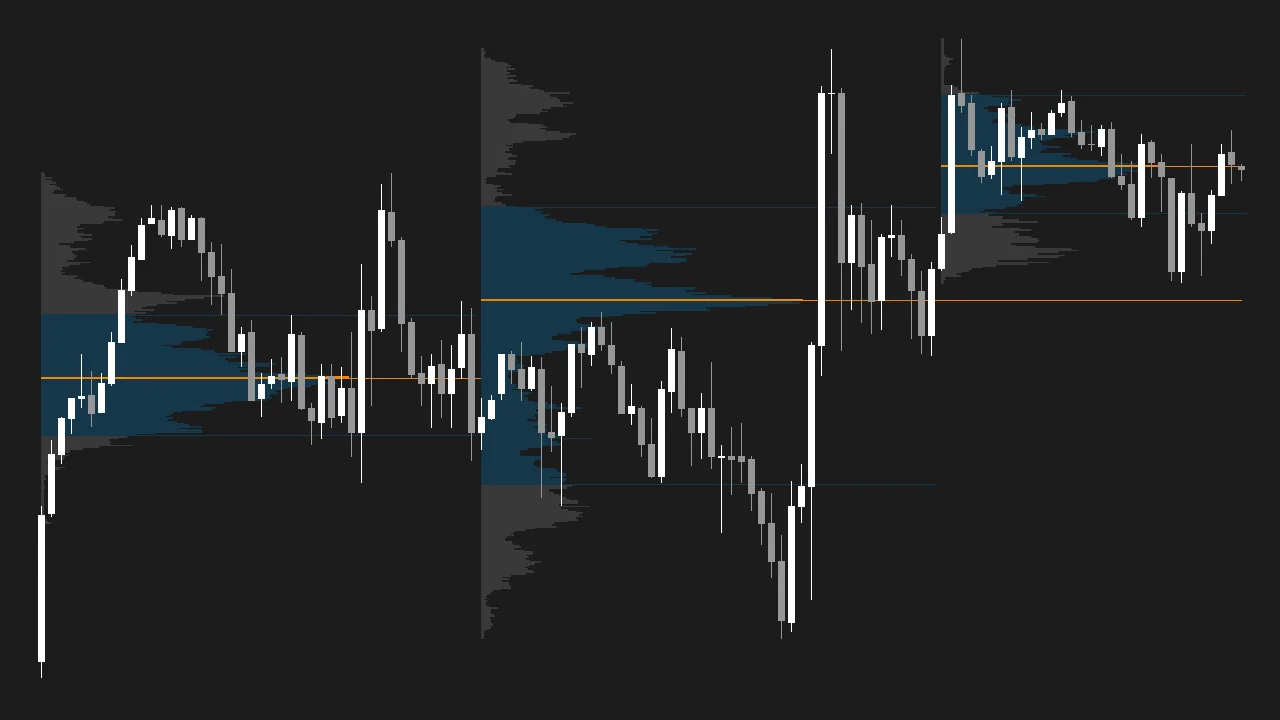
Volume Profile displays the volume traded at each price level over a selected period, providing a clear view of where market activity has concentrated.
It is a valuable complement to orderflow analysis, helping you assess the auction's development and identify key areas of acceptance and rejection. High Volume Nodes (HVNs) highlight prices where significant trading activity has occurred, while Low Volume Nodes (LVNs) identify areas with relatively little traded volume.
By analyzing volume distribution alongside price action and orderflow, you can better understand market structure and identify relevant price references for your trading.
What You Can Identify
What's Included
Last updated October 2026
Features
- Session Volume and Delta Profiles for additional orderflow context
- Multiple Volume Profile Composites to identify broader areas of acceptance and rejection
- Separate Overnight and RTH Sessions for session-by-session analysis
- Volume Profile Statistics for additional market context
- Highlighted VPOC and Value Area for quick identification of key references
- Developing VPOC (nVPOC) Extended Until Future Intersection to track untested points of control
- Initial Balance and Range Extensions to monitor session development
- Swing High/Low Lines to identify relevant market structure
- Daily, RTH, Overnight, and Full Session Reference Charts for broader market context
Installation Instructions
- Update Sierra Chart to the latest version.
- Set the time zone under Global Settings → Time Zone Settings to New York time (EST/EDT). The chartbooks are built on New York time.
- Save the downloaded chartbook file (.CHT) in your Sierra Chart Data folder (usually
C:\SierraChart\Data). - In Sierra Chart, go to File → Open Chartbook and select the file.
- Update each chart to the current futures contract under Chart → Chart Settings → Symbol.
Symbols not loading on your data feed? Go to Edit → Translate Symbols to Current Service.
Troubleshooting and contract rollover: Full install guide
This chartbook is designed primarily for ES futures. It can be adapted for other markets, but any necessary modifications and adjustments are the user's responsibility.
For personal use only. Redistribution, resale, or sharing of the files is prohibited.